Measuring success is essential for proper growth, but that’s easier said than done. If your hands have ever trembled at the thought of walking a lackluster quarterly report down the long hallway to the C-Suite, you know exactly how hard it can be. Especially if your bonus — or worse, your job — is riding on positive numbers. So what’s to blame for those dreaded valleys? Poor performance? Bad luck? The weather? Maybe. Or maybe…you were measuring the wrong Customer Experience KPIs all along.
There are so many Customer Experience KPIs to choose from. So it’s hard to know which ones deliver the best insights for your company to enhance customer experiences, motivate loyalty, and increase sales.
Here’s our top 8 Key Performance Indicators for your consideration (in no particular order):
- Net Promoter Score (NPS®)
- Customer Satisfaction (CSAT)
- Customer Effort Score (CES)
- The Worth Index
- Customer Lifetime Value (CLV)
- Share of Wallet
- Reviews and Star Ratings
- Churn rate
The Most Used Customer Experience KPIs
The best KPI for your company might not be on the list of most popular metrics. But we can start on the road to an informed decision by examining what the crowd is doing.
The four following Customer Experience KPIs are the most commonly used by CX leaders around the world.
Net Promoter Score® (NPS®)
Every company wants good word-of-mouth to spread in hopes of increasing sales. This customer loyalty survey measures word-of-mouth potential. NPS® asks customers how likely they are to recommend a particular company after interacting with them.
The idea is that if customers are excited about your company and the experience, then they’ll refer you to friends, family, or complete strangers. Customers fall into three categories: promoters 😍, passives 😐, and detractors 😡.
Pros:
According to a 2013 Nielsen study, referrals are still one of the most trusted forms of advertising, with more than 84% of users relying on recommendations before making a purchase.
It’s one of the simplest customer experience KPIs on the market, a quick one-question survey on a 1-10 scale, usually followed by an open-ended “What influenced your score?” question. NPS® is often paired with Customer Satisfaction.
Cons:
NPS® offers no deep insight into their promoters, passives, or detractors. It’s not data driven.
There’s no way of knowing what decision-making factors motivate promoters, passives or detractors to rate an experience as such. The open-ended question tries to address that problem, but without deeper analysis, the customer sentiment is easily lost.
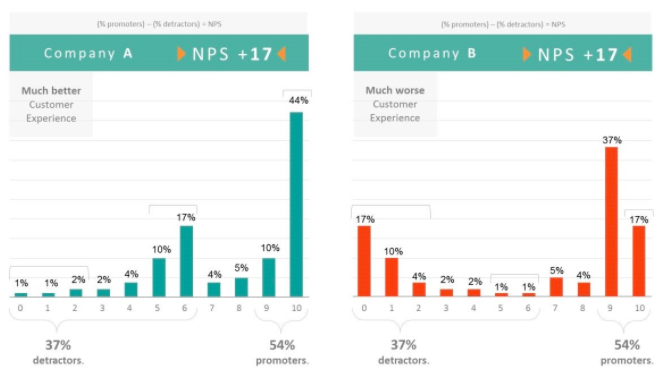
Take these two companies. Company A’s detractors rate the experience much higher than those in Company B, but NPS® gives no indication of this. Even though their NPS® scores are identical, the two companies are perceived very differently by customers.
Also, passives are a non-factor in the NPS® score. Even though they’re closer to becoming promoters than detractors.
Figuring these results into your bottom line profits is an even stickier problem. The correlation between a high NPS® score and real-world business success is foggy at best. Companies have seen their scores peak just before going out of business — Blackberry, Toys R Us, and many others.
Customer Satisfaction (CSAT)
Every company wants satisfied customers, I hope. CSAT simply gauges whether customers are satisfied with their experiences or not.
Pros:
The more satisfied you are, the more likely you are to stick around.
This metric is designed to measure customer retention. It acts as a precursor to NPS®, which is why many companies use them as a tag team. If you’re satisfied (CSAT), you’ll recommend the company (NPS®) to others, and maybe they will buy from the company as well.
A “Very Satisfied Customer” contributes 2.6 times as much revenue to a company as a “Somewhat Satisfied Customer”. So it makes sense to use Customer Satisfaction as a key metric to track.
Cons:
Like NPS®, CSAT doesn’t necessarily correlate with financial data.
Satisfaction does not always equal loyalty and dissatisfaction doesn’t always mean churn. I’m very satisfied with Android, but I’m switching to an iPhone X. I’m dissatisfied with my cable provider, but it’s the only one I can get in my complex.
CSAT doesn’t account for the many other decision drivers that motivate a purchase.
Customer Effort Score (CES)
There is nothing like feeling as if I didn’t have to lift more than a finger to get something done. CES measures a customer’s perception of how easy it is to access the benefits and overall value proposition that a company promises.
Pros:
The idea here is less is more; the less effort a customer has to exert, the more loyal they become.
CES doesn’t make experience the focal point. It’s about ease of effort and meeting customer expectations. Oracle examined a large organization and found that customer satisfaction increased from 61% to 93% when customers reported low effort.
Cons:
CES applies only to services, leaving no room for other important factors. It fails to look at potential influencing factors like product, competitors, and price. It also doesn’t tell companies how to address existing problems.
As with NPS® and CSAT, CES doesn’t concretely answer the “why” question. It isn’t clear what effect customer effort has on its customers’ decision making process. And this is critical information for companies to improve their customer experience.
Customer Lifetime Value (CLV)
A good relationship with customers is imperative for growth. This metric is a prediction of the net profit attributed to the entire future relationship with a customer.
Seventy-six percent of companies see CLV as an important concept for their organization and a key factor in driving customer loyalty. Companies that calculate some form of CLV tend to be those enjoying stronger customer experience business results.
This metric bloomed in popularity along with e-commerce, where before it was used mostly in financial services. Google Analytics is beta testing CLV to better understand the value of users as measured by revenue and engagement metrics.
This is a more complex metric that requires a lot of calculation. But if you can get this number on your customers, it will incentivize management to invest more in improving CX.
CX KPIs to Watch
These are the up-and-coming metrics that you need to know about in the modern experience economy. They are each more complete and provide deeper insights than their previous counterparts.
These metrics provide a stronger grasp on what motivates your customers. So you should consider adding these to your stack of Customer Experience KPIs.
The Worth Index
Before every buying decision, we ask ourselves one final question: “Is it worth it?” This metric offers a complete customer experience Voice of Customer KPI that helps identify why customers buy and which products, services, and experiences are most “worth it” to them. It gets to the crux of the buying decision-making process.
Worthix correlates directly with revenue. This means that companies see a clear ROI in investing in raising their Worth
Worthix uses Natural Language Processing (NLP) and AI to produce weighted rankings for both rational and emotional decisions. It predicts buying behaviors and correlates directly with financial data.
This is a great companion for NPS® and CSAT, but doesn’t have to rely on either one to produce comprehensive results.
The Worth Index received praise as one of the most effective new metrics by Customer Experience experts like Shep Hyken.
Share of Wallet
Also referred to as Share of Category, this metric is calculated based on the average market share of a brand among customers who already purchase within that brand’s product category.
For instance, if out of 10 purchases, a customer buys McDonalds 7 times, and Burger King 3 times, McDonalds has 70% share of that customer’s wallet.
It’s an unambiguous metric that can serve as a solid benchmark for companies to gauge their market penetration and customer loyalty.
Reviews and Star Ratings
If you’re anything like me, you always read reviews prior to buying. And I bypass all the great reviews to find the one or two horrible ones just to see why they complained. This KPI is like NPS®, but transparent. It lets it all hang out. In fact, 91% of consumers read online reviews on products and services.
Companies are investing in NLP solutions to analyze customer comments efficiently. It’s honest feedback that can help companies better understand customer pain points and learn what experiences are valuable to them.
Any company that cares about its reputation will be reminded by reviews and ratings that it’s always on the line.
Churn rate
A sign of a great experience is when you want to go back for more. Whenever customers cancel a subscription, fail to renew, take their business elsewhere, or close an account, it’s called churn or attrition. This is the percentage of customers who cancel their recurring services or subscriptions. The lower your churn, of course, the better. The challenge is getting to the bottom of what’s causing it.
To calculate churn, divide the total number of lost customers by the total number of active customers for a selected time period.
In Conclusion
Considering a new set of KPIs, or even adding just one, can seem overwhelming. Especially if your organization has an established metric of choice already. What’s most worth it for your company depends entirely on your unique objectives. And, of course, what matters to your customers.
Finding the right metric to satisfy both parties is tough, but if you’re reading this, you’re on the right track. If you’re looking for deeper insights, you can try out our unique CX KPI.
Want more insights from our expert network? Subscribe to the Worthix Newsletter for a monthly summary of all things Customer Experience, and be the Voice of CX in your workplace or friend group.