Customer surveys are one of the tools for gathering the insights you need to take your business to the next level of customer experience. But not everyone gets the methodologies behind well-constructed and rigorously thorough surveys. We’re here to help with that.
One of the first steps is to determine your sample size. This is a technical term that refers to the number of respondents you need to statistically represent the population you are surveying.
In this post you will learn how to use Worthix’s Survey Sample Size Calculator for CX surveying in a few simple steps. Or if you enjoy hard work, find the correct way to calculate it by hand.
But first, let’s address the importance of an appropriate sample size.
Size Does Matter
While conducting CX Surveys, in order for them to be statistically accurate, your sample size needs to be correct, especially if it is supposed to represent a larger population or data group.
For instance, let’s say you decide to run a survey on the eating habits of females in California. You interview a total of 6 people, and 2 out of 6 say they are vegan. That means, according to your study, 1/3 of all females in California are vegan.
But let’s say it has been pre-established that your population size is composed of 1,000 individuals and of those individuals, 20% is vegan.
Consider two sampling results:
- 6 responses gathered, 33.3% say they are vegan.
- 200 responses gathered, 25% say they are vegan.
- 400 responses gathered, 25% say they are vegan.
This means the first study has an incorrectly high percentage due to a poor sample representation. However as the sample size increases, we get closer to the true percentage.
Another thing you’ll need to look out for is outliers. Outliers are abnormalities in the sample. They occur when a response deviates significantly from that which is established to be ‘standard’, or the average.
Determining Sample Sizes
Now, here are some of the items you must factor into determining sample sizes:
Population Size
The total size of your demographic. This can be an approximation; it does not have to be exact.
For example, if your survey needs to target video-game users between ages 13 to 25 in North and South America, your population size would be the approximate total number of video-game users across these continents.
Whether your population is big or small, you need to know who they are in order to calculate your sample size.
Margin of Error (Confidence Interval)
Mathematically, no sample is perfect. By determining a margin of error, you are deciding which percentage of error you’ll accept in your survey.
ESOMAR, an international Market Research association, recommends that their members stick to a maximum of 3% when polling for elections.
Confidence Level
Confidence Levels works hand-in-hand with Confidence Intervals (see above).
It’s where you determine how confident (or mathematically correct) you want your margin of error to be. The most common confidence levels are between 95% and 99% confident.
Standard Deviation
A standard deviation is a measure of how far your data varies relative to the mean.
On a bell curve (or normal curve), a low SD results in a thinner bell. While a high SD results in a wider bell. This factor is normally preset at .5% since you haven’t started the survey yet.
How to Use the Worthix Survey Sample Size Calculator
Simply insert the following numbers and percentages, based on the explanation above:
- Population size: the total number of the population you are studying
- Margin of Error: Percentage between .5% and 3%
- Confidence Level: Percentage, normally 95% or 99%
How to Determine the Sample Size?
To determine the sample size, you need 4 important factors: Population size, confidence level, margin of error and standard deviation.
Population Size — The total size of your population. This can be an approximation; it does not have to be exact. For example, if your survey needs to target video-game users between ages 13 to 25 in North and South America, your population size would be the approximate total number of video-game users across these continents.
Confidence Level — Confidence Levels works hand-in-hand with Margin of Error. It’s where you determine how confident (or mathematically correct) you want to be regarding your margin. The most common confidence levels are between 95% and 99% confident.
Margin of Error (Confidence Interval) — Mathematically, no sample is perfect. By determining a margin of error, you are deciding which percentage of error you’ll accept in your survey. The standard margin of error is between 3% and 5%.
Standard Deviation — This is used to measure how far your results may vary from the mean once you have collected and analyzed your data. For this calculator, we have pre-established the value at .5, since the calculation is pre-survey.
The Math Behind the Science
When calculating survey sample sizes, you have two options. You can either calculate the sample size manually or use our Survey Sample Size Calculator. The calculator takes out all the brunt work, but if you really want to do it by hand, here’s the math:
Start by establishing your Z-Score from your Confidence Level. Here’s a Z-Score cheat sheet, or just use this base:
- 90% – Z Score = 1.645
- 95% – Z Score = 1.96
- 99% – Z Score = 2.576
Here’s what the formula looks like:
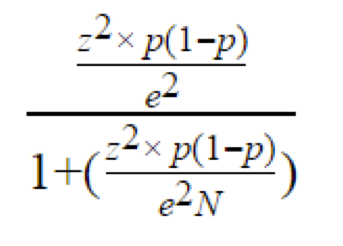
Parameters:
- Population size= N
- Margin of Error = e
- Z-Score= z
- p= Standard Deviation
This video by Khan Academy will walk you through the process, step-by-step.
I’ve Got My Sample Size. Now, How Do I Start Surveying?
The next step after securing your survey sample size is choosing a methodology for designing your questionnaire.
Or, if you appreciate cutting-edge tech innovations, try a self-adapting, pre-programmed questionnaire. This survey-like experience allows your customers to lead the conversation. That means no programming questions that only extract information you think to ask about.
Request a demo to see how Worthix can uncover what matters most to your customers.